Counts vs Density
Both columns show the same 500 observations with two different binning schemes. With equal-width bins, counts and density have the same shape. With variable-width bins, raw counts favor wider intervals and can distort the visual comparison.
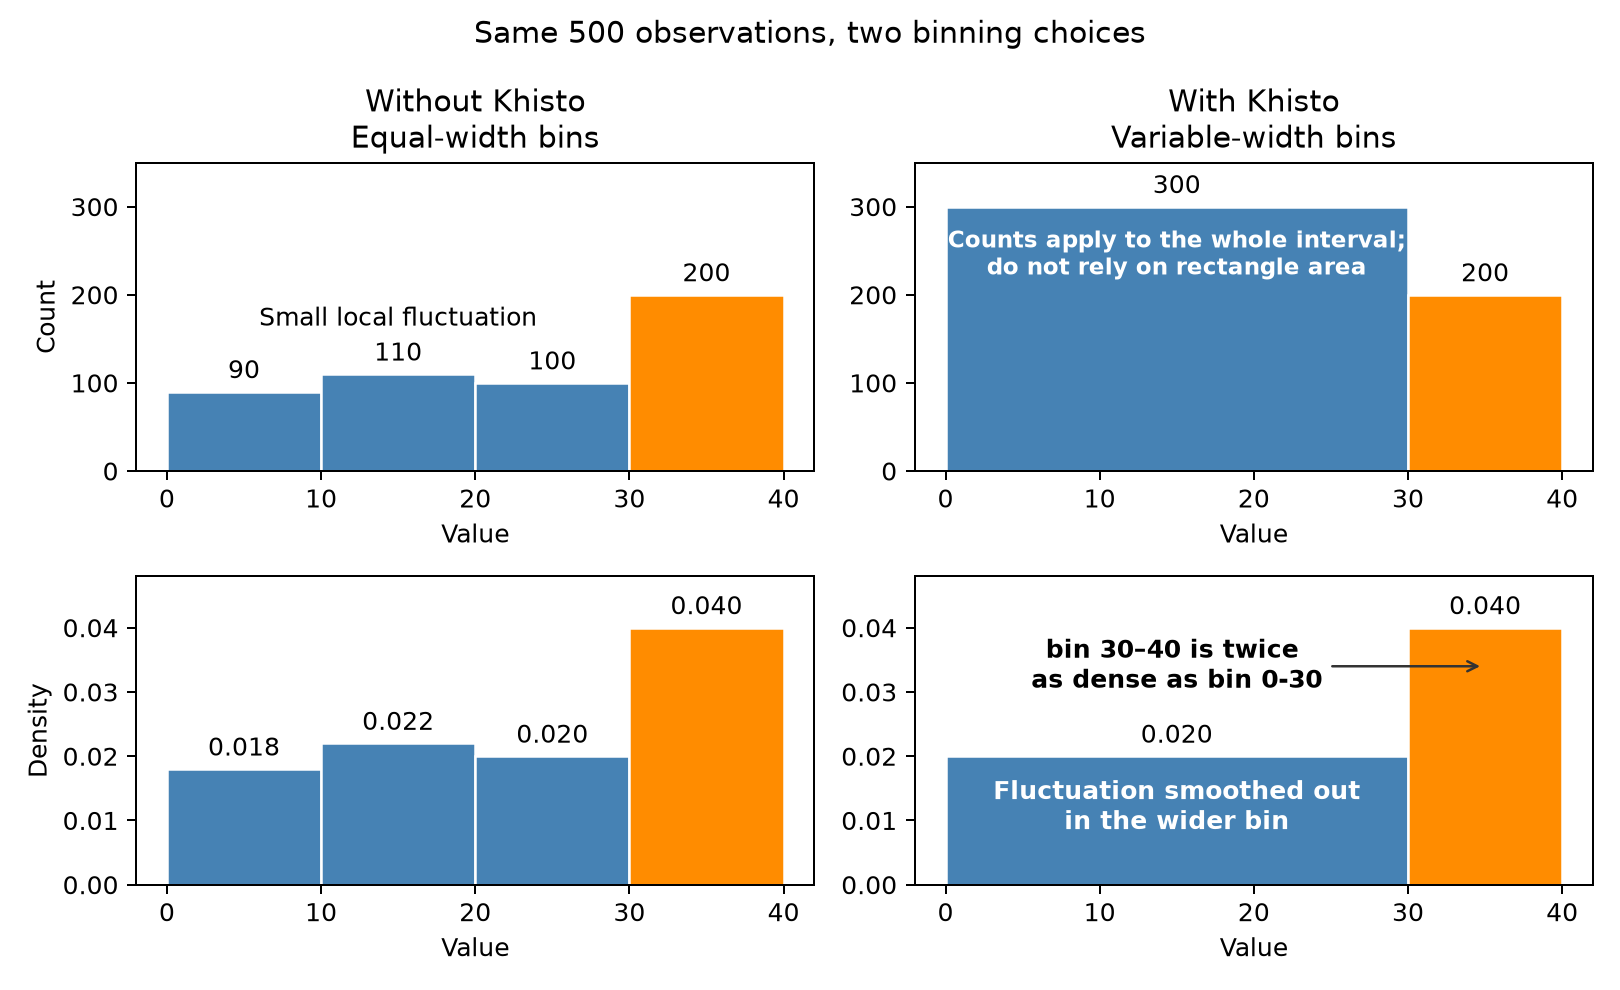
With equal-width bins, taller bars indicate a greater probability of falling within that interval. When bin widths vary, height alone is not enough: probability is represented by the bar’s area, calculated as density multiplied by bin width.
Note that variable-width bins are ideal for unbalanced distributions and outliers, as shown in Histograms - Khiops.
Reading variable-width histograms
Question |
Use |
What to compare |
|---|---|---|
How many observations? |
Counts ( |
Bar heights |
What fraction of observations? |
Counts divided by \(N\), or density times bin width |
Bar areas |
Where are values concentrated? |
Density ( |
Bar heights |